RECORDING INSTRUMENTS:
Automatic Weather
Station (AWS)
Davis Vantage Pro 2
Outdoor Remote sensors monitor:
temperature, relative humidity,
rainfall (tipping bucket), wind speed/direction,
solar radiation, UV, which then calculates dew point, wind chill etc
Indoor Base Station monitors:
indoor temperature, humidity,
atmospheric pressure etc
Data is automatically logged (half hourly)
Manual Observations at 0900
5" raingauge,
cloud cover,
visibility, weather diary

Guidelines for Making
Observations
click
here for details
Data Processing
Hourly AWS data is downloaded
to my PC and imported into my
Microsoft Access database. Manual Observations are keyed in.
Daily Records are then extracted and imported
into my own
customised 'Integrated Database' (also using Microsoft Access)
which holds
Halesowen records from 1956 to
the present.
Further processing produces monthly and annual summaries, comparing recent weather with
that of previous years, and identifying longer term trends.
The database is capable of
viewing the raw data is virtually any manner,
and can export results into Excel for further analysis and plotting
graphs.
Monthly data is uploaded
to this website at the end of each month, and annual summaries at the
end of each year. Long term records are also updated at the end of each
year.
A Monthly summary is
submitted to Climatological
Observers Link .
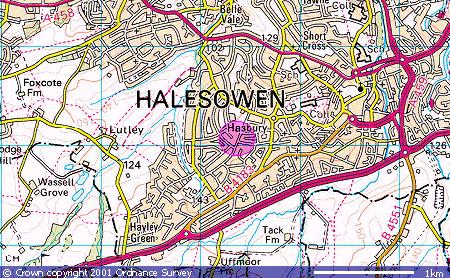
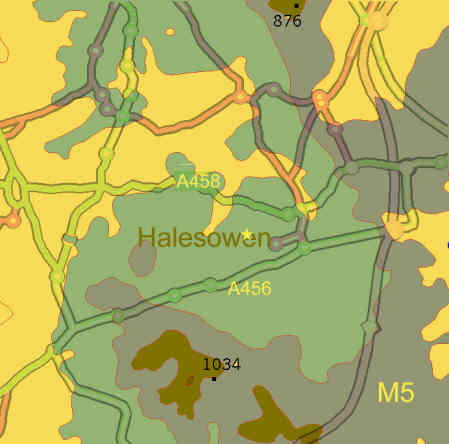
Data from 2005 is my own,
recorded at my own location in Hasbury, Halesowen, West Midlands..
Data from 1956 to 2004 was
sourced from a previous nearby weather station in Halesowen which had been
run by Cedric Roberts MBE.
More about Cedric and a selection of his own summaries can be found here.
I have integrated some of his data from his spreadsheets into my own
Integrated Database to provide a continuous series of records from 1956 to
the present.
Colin Prior
info@halesowenweather.co.uk
HalesowenWeather