Variations in data are usually related to a benchmark of a
thirty year period, and here are the averaged values from 1971-2000...
these have now been replaced by 1981-2010
summaries
30 year Halesowen Observed Monthly Temps
and Rainfall based on period 1971-2000
These are based on actual observations made in
Halesowen over this period.
| M |
mean
max temp degC |
mean
daily temp degC |
mean
min temp degC |
total
rain mm |
| 1 |
6.6 |
3.9 |
1.1 |
72.0 |
| 2 |
7.1 |
3.9 |
0.8 |
50.2 |
| 3 |
9.7 |
6.1 |
2.4 |
59.6 |
| 4 |
12.5 |
8.0 |
3.6 |
58.1 |
| 5 |
16.3 |
11.3 |
6.4 |
54.8 |
| 6 |
18.9 |
14.1 |
9.3 |
59.9 |
| 7 |
21.6 |
16.6 |
11.5 |
48.5 |
| 8 |
21.1 |
16.2 |
11.2 |
65.9 |
| 9 |
17.8 |
13.5 |
9.1 |
69.5 |
| 10 |
13.7 |
10.0 |
6.4 |
70.3 |
| 11 |
9.5 |
6.4 |
3.4 |
68.4 |
| 12 |
7.3 |
4.7 |
2.0 |
77.6 |
| OVERALL |
mean=13.5 |
mean=9.6 |
mean=5.6 |
sum=754.9 |
MeanMax= mean of Max temps for the month, deg C
Mean = mean temp for the month, deg C (defined as (min+max) /2 )
MeanMin= mean of Min temps for the month, deg C
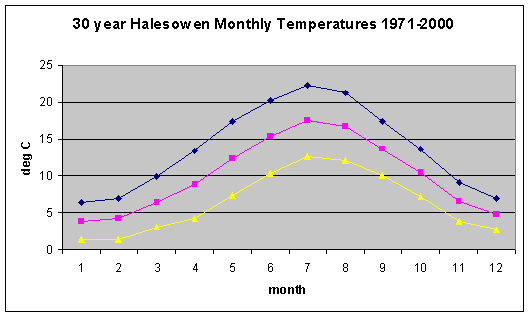
30 year Halesowen
Standardised Monthly Temps and Rainfall based on period 1971-2000
These are expected values
using a national grid of data held by COL, and interpolated for this location.
| M |
mean
max temp degC |
mean
daily temp degC |
mean
min temp degC |
total
rain mm |
| 1 |
6.4 |
3.9 |
1.4 |
74.3 |
| 2 |
7.0 |
4.2 |
1.4 |
51.8 |
| 3 |
9.9 |
6.5 |
3.1 |
61.5 |
| 4 |
13.4 |
8.9 |
4.3 |
60.0 |
| 5 |
17.4 |
12.4 |
7.4 |
56.6 |
| 6 |
20.2 |
15.3 |
10.3 |
61.8 |
| 7 |
22.3 |
17.5 |
12.6 |
50.1 |
| 8 |
21.2 |
16.7 |
12.1 |
68.0 |
| 9 |
17.4 |
13.7 |
10 |
71.7 |
| 10 |
13.7 |
10.5 |
7.2 |
72.6 |
| 11 |
9.2 |
6.6 |
3.9 |
70.6 |
| 12 |
6.9 |
4.8 |
2.7 |
80.2 |
| OVERALL |
mean=13.2 |
mean=10.1 |
mean=6.4 |
sum=779.2 |
30 year mean standardised monthly temperatures,
month 1=Jan, 2=Feb ......12=Dec

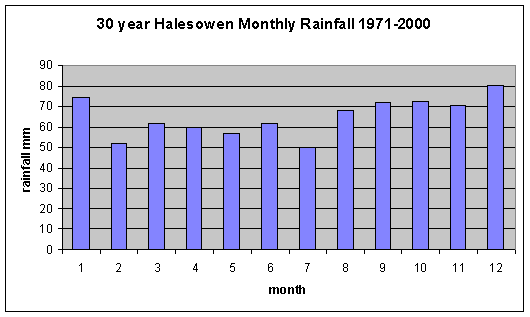
30 year Halesowen standardised Rainfall
1971-2000
Monthly rainfall totals in mm for each month,
where month1=Jan ......month 12=Dec

