|
|
|
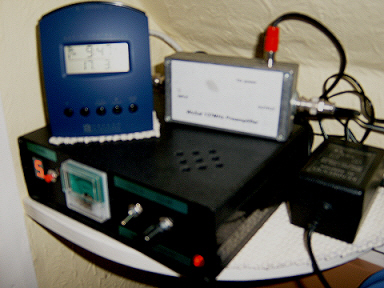
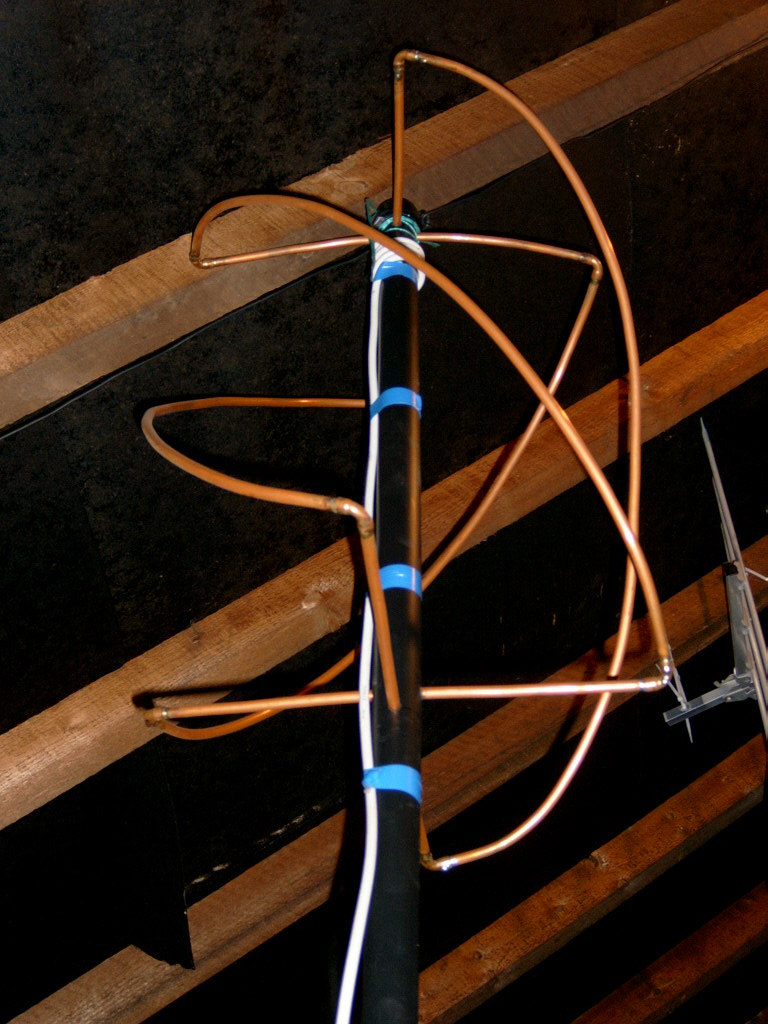
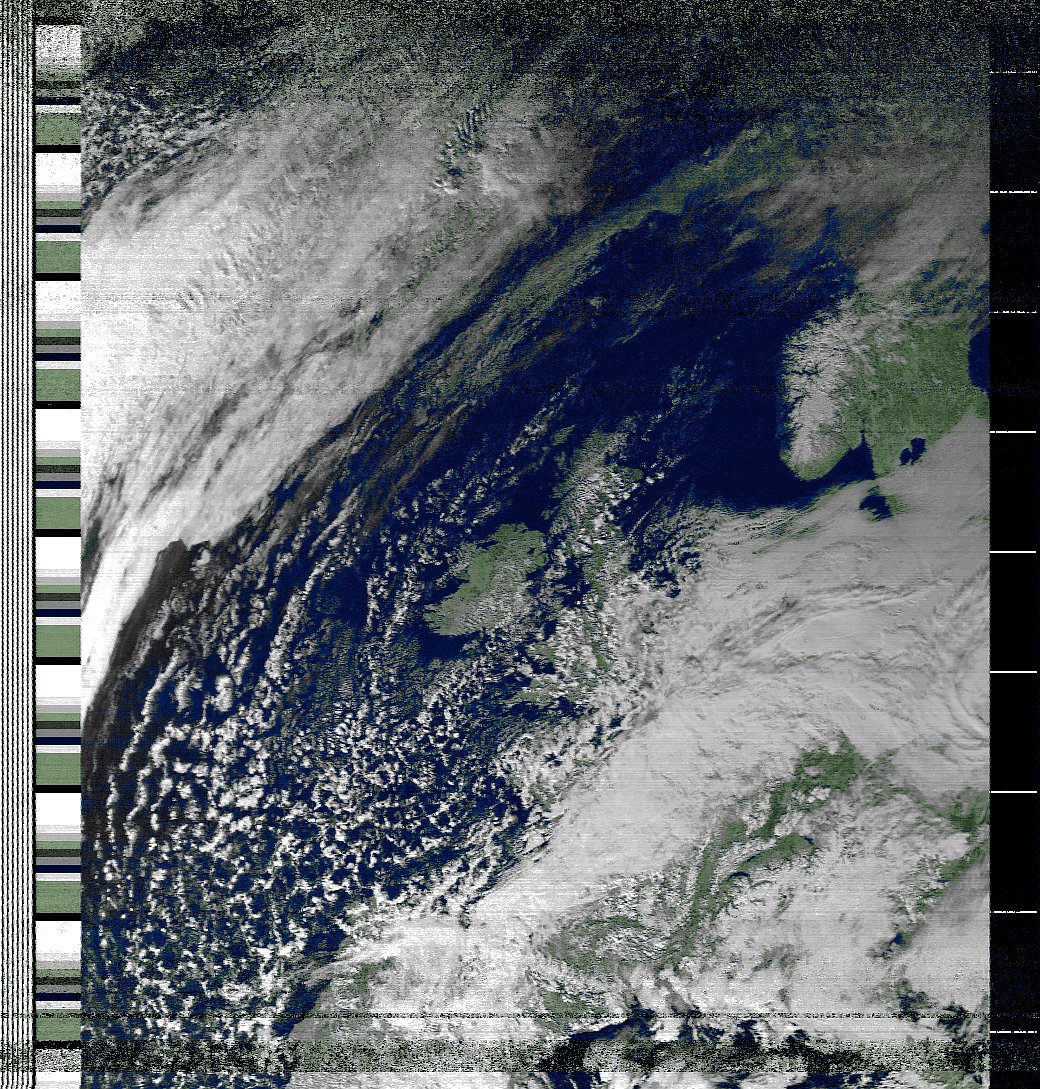
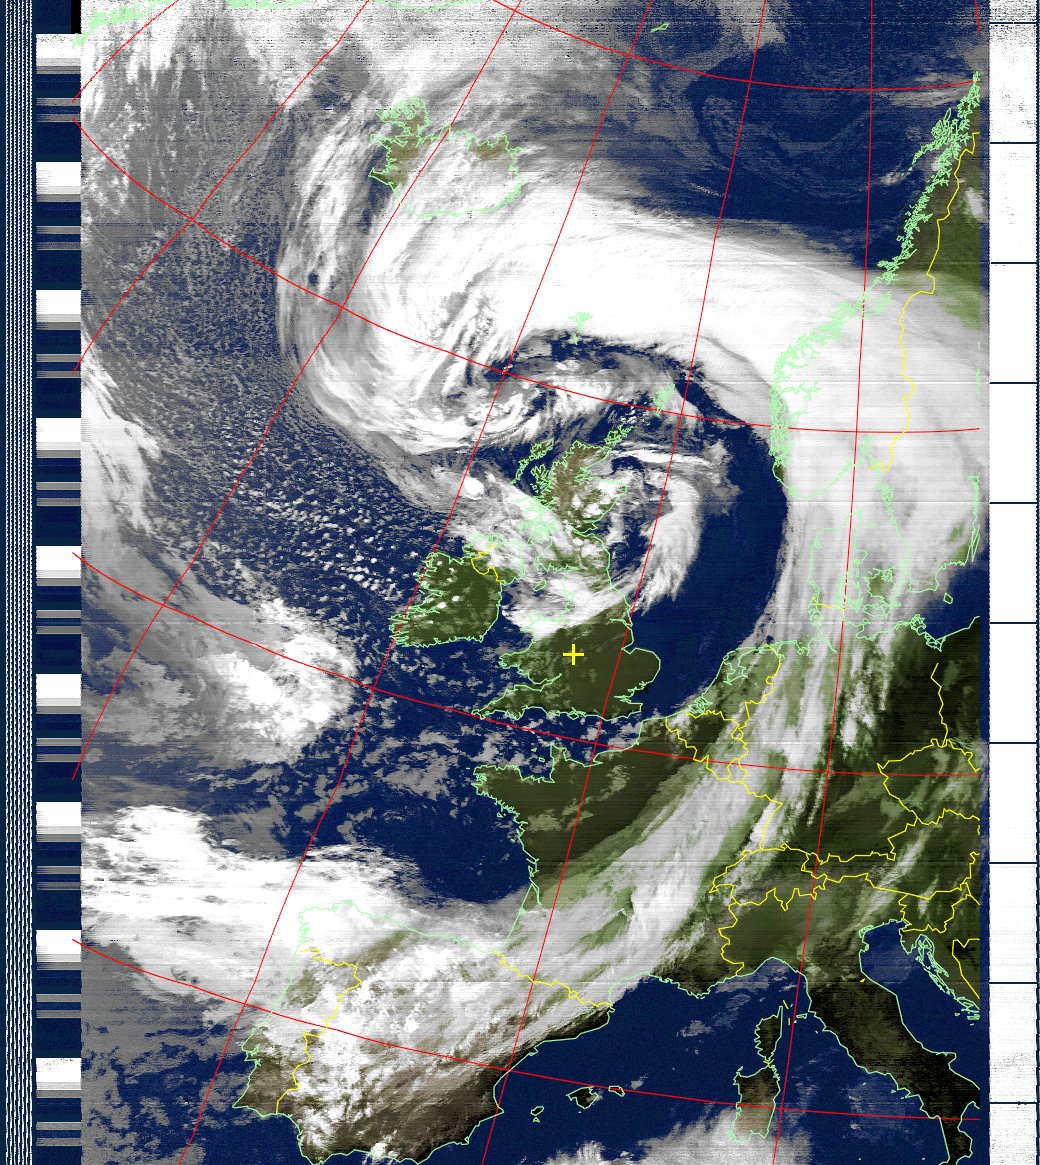
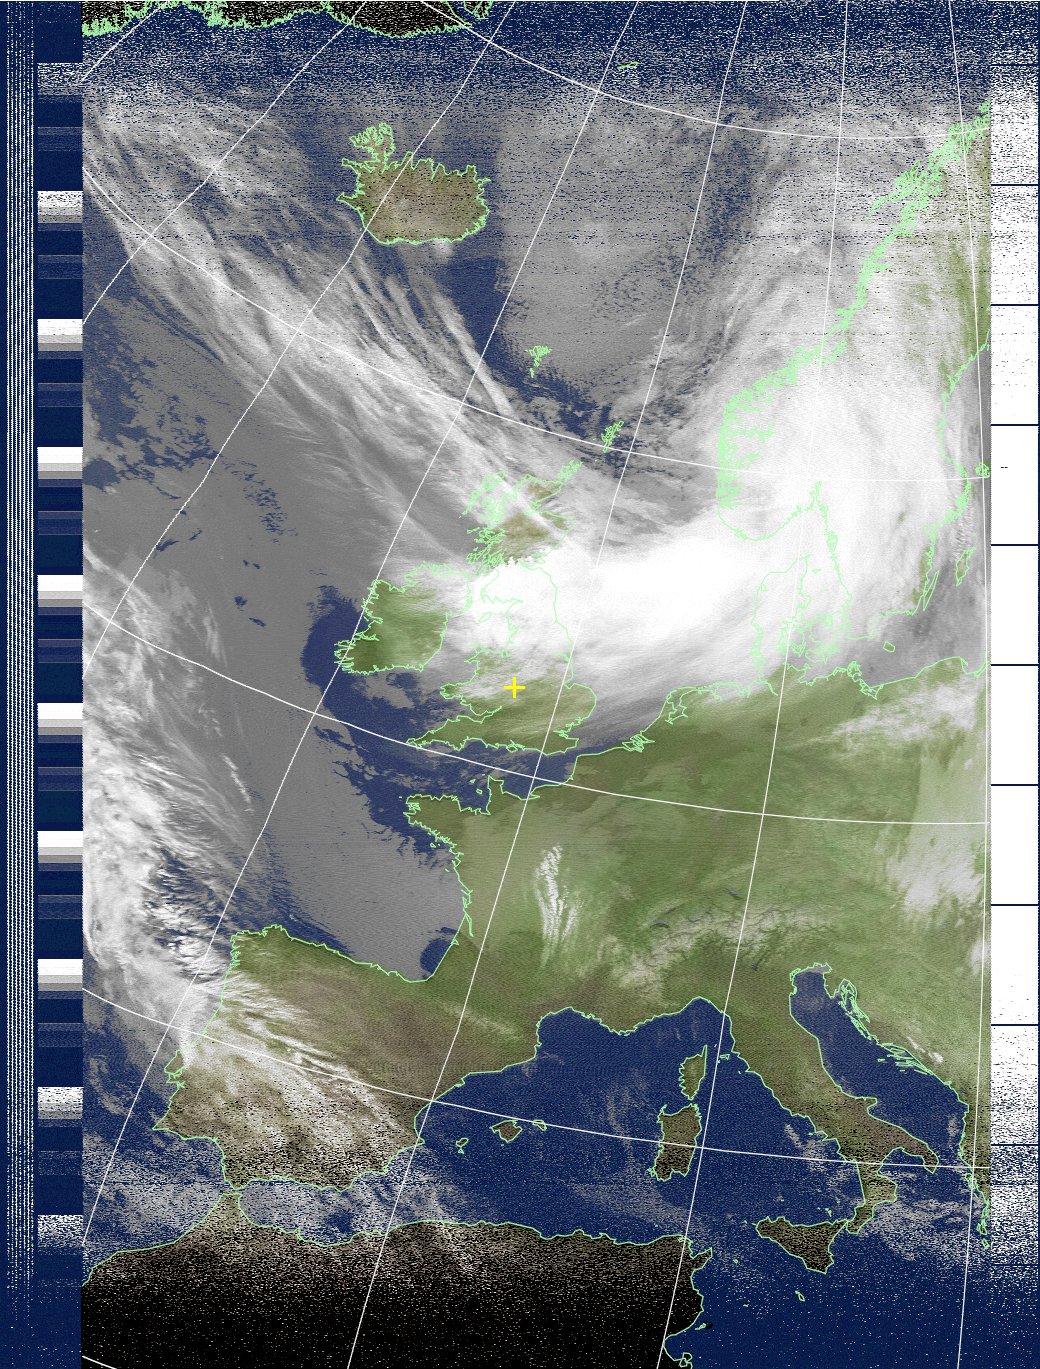
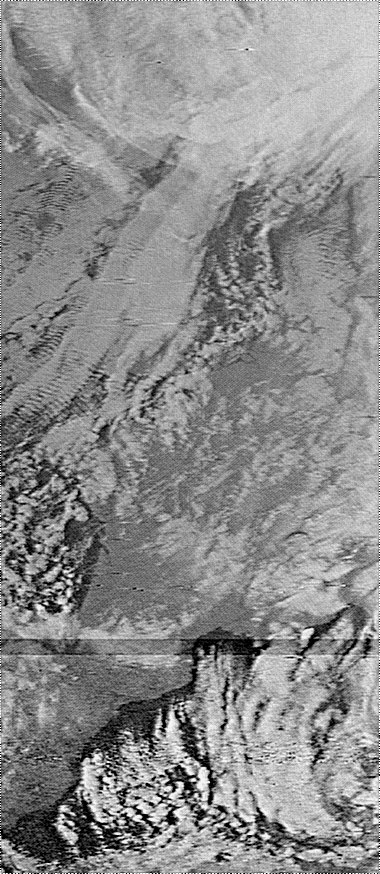
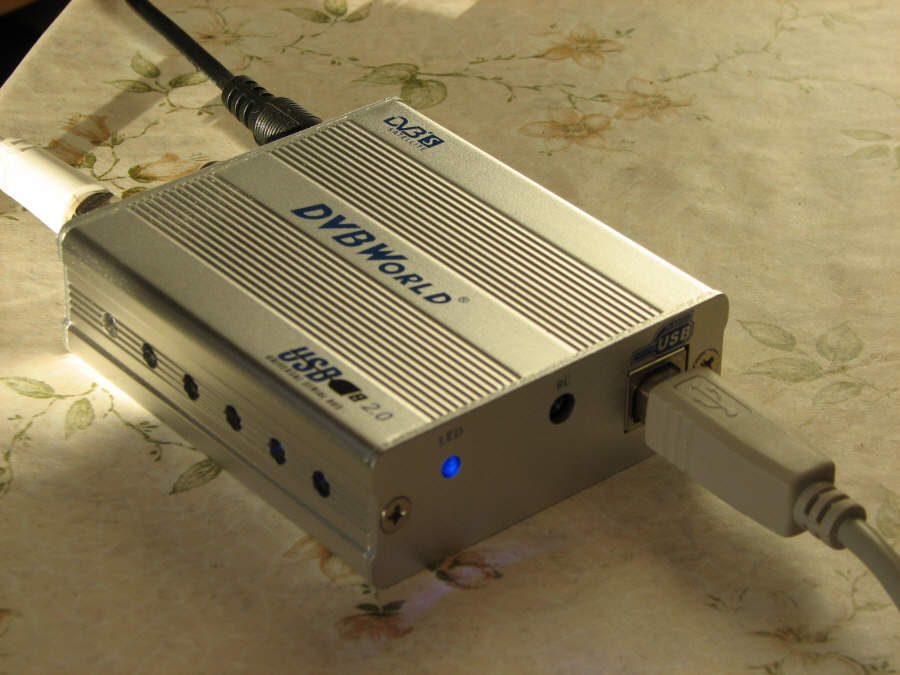
Low Earth Orbiting Satellites using APT I can receive weather satellite images from the NOAA15, 17, 18 and 19 low earth orbiting satellites which pass over the UK several times a day transmitting in the 137MHz satellite band. Satellite overhead passes occur at different angles of elevation above the horizon, as the satellite is following a different path each time (because the earth is spinning), so the best images will come from passes where the elevation is high in the sky, clear of obstructions like other houses and trees, and it follows that the UK will be fairly central on the image received. The satellite will only be above the horizon for about 12 minutes or so, passing roughly north to south or south to north depending on where the position of the earth relative to the satellite's orbit. The signals transmitted are quite strong, and can be received with any receiver which covers 137MHz FM, although the bandwidth is around 25kHz, which is too wide to pick up well on a narrow band FM amateur communications receiver, but too narrow to pick up well on a wide bandwidth broadcast receiver. Best results will be obtained with a receiver with a bandwidth matching that of the signal, and specially designed receivers are available from GEO. I built my RX2 receiver from a kit, and it is housed in a black plastic case (see photo). It scans the satellite channels in the 137MHz band in turn and locks onto an active channel for the duration of the satellite pass. A meter displays signal strength and switches control whether the audio comes from the receiver or not. The aerial has to be able to receive signals with circular polarisation, and two types often used are turnstile and QFH (quadrifilar helix). I made my QFH using small bore central heating pipe, and it is supported on a length of black plastic downpipe in my loft space (see photo). The signal picked up by the QFH is fed via a pre-amplifier (the box sitting on top of the receiver with the red plug on top) into the receiver itself. The audio output goes into a computer for decoding and image generation. The images sent down from the satellites consist of a visible light (in the daytime) and an infra red image, and are black and white, but the WxToImg software can create false colour images like those shown below. The satellite is only "visible" above my horizon, from just over North Africa to southern Greenland, so the images consist of a tall narrow strip of the earth's surface visible to the satellite as it passes over. WxTrack software is used to find out which satellites are due to pass and at what time, hence the blue radio controlled digital clock sitting on top of the receiver, which is important as you need to know the exact time to catch it as it goes over you!
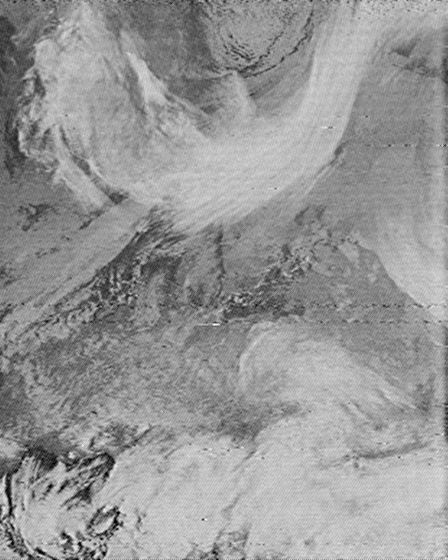
The images below are more of historic interest to me, as they were amongst the first I downloaded myself from an orbiting satellite...
Geostationary Satellite - Meteosat Second Generation MSG-2 If you are really serious about downloading top quality digital weather satellite images, then life gets much more complicated. There
are several meteorological geostationary satellites over the equator, and the
current MSG (Meteosat Second Generation) was launched in 2002 by EUMETSAT
primarily for earth imaging.
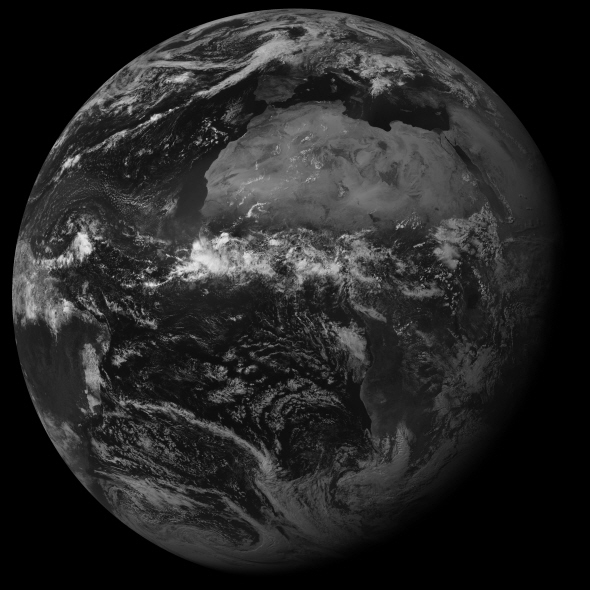
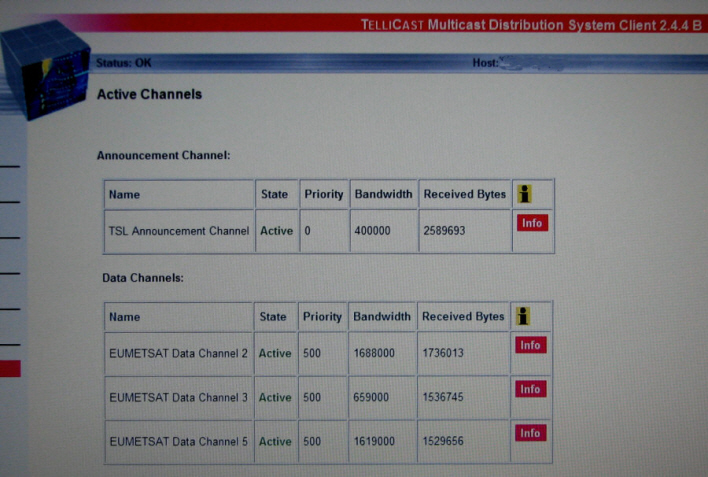
The digital data stream from MSG is downloaded to a Control and Processing Centre at Darmstadt in Germany where it is processed, combined with data from other weather satellites, then sent to Usingen where it is re-transmitted to the Eurobird broadcast satellite, which uses one of its transponders (transmitters) for transmitting the vast volume of digital weather data to users' own satellite dishes. So all you need is a satellite dish (at least 80cm), a satellite receiver (like the DVBWorld USB receiver from GEO) which is able to receive these transmissions, one computer to take the digital data files, save the many files received to disk, suitable software to decode these files, join them together into complete images (best done with a second computer, as the first one will be very busy just decoding the data stream), software to actually display the images you've now got. You also need a licence from Eumetsat to allow you to receive the data at all, Tellicast software to acquire the raw data files, and well as a dongle for the computer. And an awful lot of time, patience and dedication to get this all to work successfully. I am getting into this, albeit slowly! It is not plug and play stuff!
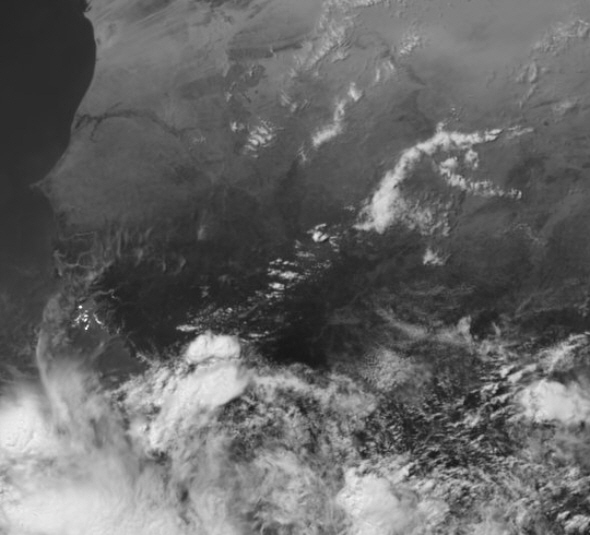
The images show the DVBWorld USB satellite receiver box, one of the Tellicast screens showing data stream currently being received, and two (very compressed for this website) sample images received from channel 01 on 18th June 2008, the whole earth visible disk, and a zoomed in clip of west Africa (taken from just above the centre of the image). The full resolution images do contain amazing detail and the illustrative samples shown on this website do not do them justice.
These earth images are copyright "Meteosat Data ©2008 EUMETSAT". Eumetsat's website is http://www.eumetsat.int |
| © www.halesowenweather.co.uk email: info@halesowenweather.co.uk |